Summary of Work for August 1999 (Project #14-08239-F)
Computational Support for the HEU to LEU Conversion of the UMLRR
Dr. John R. White, Justin Byard, and Areeya Jirapongmed
The August 1999 Progress Report represents the completion of the computational support component of Project #14-08239-F. Our goal was to develop the models and computational infrastructure necessary to characterize the new LEU core, and to actually evaluate and summarize as much information about the new core as possible. We have been quite successful in our efforts. In particular, three primary tasks have been completed since initiation of this project in early 1999:
Many of the tools, models, and characterization data referred to within the above three task summaries have already been discussed in previous Progress Reports. Any items not treated previously or projects with significant new information from work completed in August 1999 are addressed and summarized here. In particular, this report briefly overviews the three main Matlab processing programs written to assist in model generation and analysis, summarizes the blade worth and other reactivity worth data available to date, and tabulates and displays some of the characterization data for several of the UMLRR irradiation facilities. Much of the work for the month of August 1999 was focused towards completing the processing codes (especially PLOT_FLUX) and generating a variety of physics information for the LEU reference startup core. Thus, presentation of these data represents a review of the work for this month as well as a good summary of many of the final results of this study.
Model Generation and Post-Processing Tools
In developing the models and performing the analyses for the current study, a real effort was made to semi-automate some of the pre- and post-processing tasks that must be performed every time a similar analysis is needed. Since our current methodology relies on the coupling of the VENTURE and DORT codes, consistent models and data transfer between the codes are essential. A series of three Matlab codes have been developed over the course of this study to help build the VENTURE and DORT models and to help analyze the flux and power distribution results from both codes. These three Matlab routines, along with a brief description of their primary function, are summarized as follows:
PLOT_VGEO
The plot_Vgeo.m routine was developed as a geometry visualization tool to help in debugging 3-D VENTURE geometries. It can plot a combination zone and material map for any XY, XZ, or YZ plane within the model. However, on option, PLOT_VGEO can also write a significant portion of the actual VENTURE input file by calling another Matlab script file called write_Vgeo.m. These capabilities have saved, and will continue to save countless hours of VENTURE input preparation and debugging. This code works equally well for both 2-D and 3-D Cartesian geometry models.
PLOT_VGEO requires three data files that are written in the form of Matlab script files, as follows:
*_Vgeo.m -- contains the basic geometry information including the x, y, and z-directed region boundaries, the number of fine mesh intervals by region information, and a large array that gives the zone by region mapping.
*_Vmat.m -- contains title information for the homogeneous materials within the system and the material by zone array for a specific model.
*_Vden.m -- includes information about the individual isotopes and corresponding atom densities for each homogeneous material in the model.
In practice, the *_Vgeo.m and *_Vden.m files are the difficult ones to prepare and, as for any mathematical modeling project, one must have a good understanding of the physical system and some experience with VENTURE in order to generate the needed data. However, these files are only generated once for each model of interest. These essentially fix the geometry and the materials that comprise the system. The *_Vmat.m file, however, will probably change for each case of interest, since this sets the material by zone mapping for each individual VENTURE run. Each new fuel layout, control configuration, or experimental sample arrangement will require a slight change to the *_Vmat.m file. Re-executing PLOT_VGEO with reference to the new material information file then gives a new material by zone map and a new input file for VENTURE. Running VENTURE with this new data allows one to investigate the effect of the material change on any reactor performance parameters of interest.
PLOT_VPWD
The PLOT_VPWD code plots the VENTURE-generated power distribution and, if needed, it converts the power density profile into the spatial component of the fission source distribution that is required for a DORT fixed-source calculation. In addition to the fission source (96** array), this code also write a large portion of the complete DORT input file, including the geometry information (2**, 4**, and 8$$ arrays), the material distribution (9$$ array) and, on option, enough information so that a transverse buckling approximation can be included (6** array). These data are written by the write_Dgeo.m routine which is called at the end of plot_Vpwd.m. At present, the DORT input generation capability only exists for a 2-D XY computational model.
The same base data files that were used with PLOT_VGEO are also needed here (*_Vgeo.m, *_Vmat.m, and *_Vden.m). If the DB2 option is selected, an ANSIN-formatted library of microscopic cross sections is also needed for computation of the diffusion coefficient by group and zone. Since ![]() , the transport cross section must be contained as an "extra" cross section within the base library.
, the transport cross section must be contained as an "extra" cross section within the base library.
Clearly, in order to work with the VENTURE power densities, a PWDINT power density interface file must be written as part of the VENTURE run. A short Fortran processing code called TRANSPWD was written to convert the sequential binary PWDINT file into a transparent binary file that can be read directly within the Matlab-based PLOT_VPWD code. Thus, one must be sure to save the appropriate VENTURE power density file, and to do the translation to transparent format before running PLOT_VPWD.
PLOT_FLUX
The last code in the sequence is simply a post-processing routine that creates a variety of flux plots, including 1-D X-, Y-, or Z-directed profiles and 2-D surface plots of the flux distribution on any XY, XZ, or YZ plane of interest. The code requires the *_Vgeo.m data file to define the geometry and, of course, a saved flux file from VENTURE or DORT. The VENTURE fluxes are written to a sequential binary file that follows the CCCC RTFLUX interface file structure and, as above, a Fortran translation program, called TRANSFLX, was written to convert this to "transparent" form for use within Matlab. Thus, the processing of a VENTURE power density file (PWDINT) or flux file (RTFLUX) follows very similar paths.
DORT, on the other hand, usually writes a very large binary flux file that contains the angular flux information stored in terms of the angular flux moments (expansion coefficients). This file must be processed through either the PROCESS code or the FEWGRP2D code to extract the scalar fluxes and/or response data that are usually of interest in analysis. These two codes were written locally a few years ago to post process the DORT scalar flux data. They have been modified as part of this project to write the scalar fluxes in a simple ascii-formatted file that can be downloaded from the Unix machine to the PC. At the PC level, further processing is needed with TRANSFLX to write the data in transparent RTFLUX format and then with PLOT_FLUX for final visualization of the data. Within this context, the PROCESS code simply writes the full space- and energy-dependent scalar flux data from DORT. In contrast, FEWGRP2D gives one the option to collapse the multigroup fluxes into a broad-group structure for subsequent visualization. It also allows the use of an energy-dependent weight function so that various responses (i.e. reaction rates) can be created and plotted. The most common option here is simply to collapse the multigroup data into a few-group structure so that one can focus on the spatial distribution of the few group neutron and gamma flux distributions. This approach also significantly reduces the amount of data required for download to the PC and for processing in PLOT_FLUX. However, there is plenty of flexibility here for the user to be as creative as desired -- within the limitations of the PCís memory and disk storage capacity.
NOTE: Selected examples of the geometry, power density, and flux/response plots generated with earlier versions of PLOT_VGEO, PLOT_VPWD, and PLOT_FLUX are given in previous reports (see previous Progress Reports and Ref. 2). A set of selected 1-D profiles and 2-D color surface plots of the geometry, the power density distribution, and the few-group fluxes for the LEU315 critical core (control blades at critical height) are also available (see below). These plots were generated with the latest versions of the processing codes, and they provide a large amount of good qualitative and quantitative information about the reference just-critical LEU fueled UMLRR with the blades banked at 16.5" withdrawn.
Summary Reactivity and Blade Worth Data
In previous Progress Reports we have given various results concerning excess reactivity and blade worths for the reference LEU fueled UMLRR. In addition, in July 1999, a detailed study of the differential and integral worth curves for Blade #1 was made, including some discussion relative to the best choice of a mathematical model for fitting the blade worth data. Similar analyses for the other control blades and the regulating blade were continued during August 1999 and these data, along with some additional reactivity worth information, are summarized in this section.
In particular, Table I presents much of the summary reactivity worths associated with the reference LEU215/LEU315 VENTURE models. Some of the worths were computed with the 3-D model, but many of the table entries -- like the individual blade worths -- can be estimated quite accurately in 2-D XY geometry. Thus, the 3-D column is not complete and, where appropriate, the 3-D worths can be assumed to be approximately the same as the worths computed with the 2-D model. In these cases, the words "about same" are inserted into the 3-D column. Note also that all the data here were computed with the VENTURE 2-group cross section library generated specifically for this study (Ref. 2).
From Table I we see that the best estimate of initial excess reactivity with the reference 21-element core is roughly 3.2 - 3.7 ![]() . This range is well within the upper design limit, yet it represents sufficient excess reactivity for routine operation of the facility over a relatively long period of time. Additional positive reactivity to counteract burnup effects can be achieved quite easily by moving the partial assemblies to lower worth locations, by replacing the partial elements completely with full fuel assemblies, or by simply replacing the four water baskets in the B3, B7, F3, and F7 locations with graphite reflector blocks. The worth associated with exchanging the four water baskets with graphite reflector assemblies, for example, is about 1.2 - 1.4
. This range is well within the upper design limit, yet it represents sufficient excess reactivity for routine operation of the facility over a relatively long period of time. Additional positive reactivity to counteract burnup effects can be achieved quite easily by moving the partial assemblies to lower worth locations, by replacing the partial elements completely with full fuel assemblies, or by simply replacing the four water baskets in the B3, B7, F3, and F7 locations with graphite reflector blocks. The worth associated with exchanging the four water baskets with graphite reflector assemblies, for example, is about 1.2 - 1.4 ![]() . The other moves suggested above also represent large reactivity increases as seen in Table I. Thus, we expect that the base 21-element core configuration, with only minor modifications, will be the operating arrangement for quite a while.
. The other moves suggested above also represent large reactivity increases as seen in Table I. Thus, we expect that the base 21-element core configuration, with only minor modifications, will be the operating arrangement for quite a while.
Table I Summary reactivity results for the reference LEU configuration.
|
Calculated Worths*
|
VENTURE 2-D model |
VENTURE 3-D model |
Data from integral worth curves |
|
Excess Reactivity |
|||
|
Initial excess reactivity |
3.26 |
3.67 |
--- |
|
PAs in C5+E5 moved to C4+E4 |
0.61 |
about same |
--- |
|
PAs in C5+E5 moved to C3+E3 |
1.27 |
about same |
--- |
|
PAs in C5+E5 replaced by FAs |
2.07 |
about same |
--- |
|
4 water baskets replaced with graphite reflectors |
1.20 |
1.36 |
--- |
|
Blade Worths and Shutdown Margin |
|||
|
Blade 1 worth |
2.68 |
2.66 |
2.71 |
|
Blade 2 worth |
2.62 |
about same |
2.78 |
|
Blade 3 worth |
3.30 |
about same |
3.41 |
|
Blade 4 worth |
3.37 |
about same |
3.50 |
|
Total blade worth |
11.97 |
about same |
12.40 |
|
Worth of flooded beam ports |
--- |
0.44 |
--- |
|
Shutdown margin |
4.40 |
3.99 |
4.29 |
|
Regulating blade worth |
0.39 |
about same |
0.40 |
|
Sample Worths |
|||
|
Standard sample in D2 |
--- |
0.07 |
--- |
|
Standard sample in D5 |
--- |
0.37 |
--- |
|
*Notes:
|
|||
Also given in Table I are the total control blade and regulating blade worths and the computed shutdown margin for the reference core. The first two columns of blade worths (for the 2-D and 3-D models) are computed using the difference in keff values for the blade-in versus blade-out configuration, with all the other blades fully withdrawn (the reference model here is the all-blades-out configuration). The last column of blade worth data are derived from the integral blade worth curves using the combined cubic polynomial plus sinusoidal model -- see a more detailed discussion below. Of interest here is the fact that the integral curve comes from a bottom-peaked differential worth distribution, which is the result of having the blades banked at some position within the active fuel height to maintain criticality during operation (needed to offset the excess reactivity). Although the differential worth curve is somewhat bottom peaked, the additional worth in the bottom just about offsets the reduced worth at the top to give a total worth that agrees reasonably well with the simple in-out 2-D calculation given in the first column of Table I. This good agreement (about 3 - 5 % differences in the ![]() values) gives additional confidence in this whole series of computations.
values) gives additional confidence in this whole series of computations.
As apparent from Table I, Blades #1 and 2 are worth less than Blades #3 and 4. This is due primarily to the asymmetry associated with having a full fuel assembly in the D8 grid location (see Fig. 1). However, this asymmetric blade distribution is quite consistent with the distribution observed in the current HEU core (Ref. 1). Routine operation of the facility should not be adversely affected by this mild asymmetry.
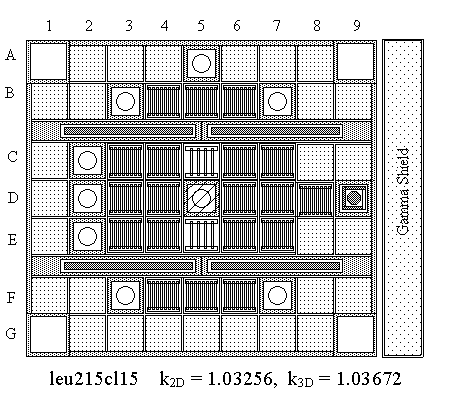
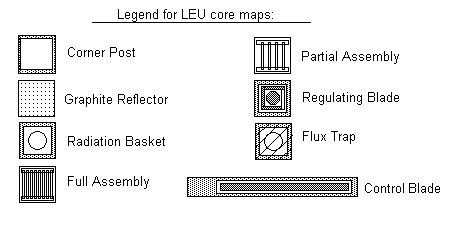
Fig. 1 LEU215/LEU315 reference core configuration with legend guide.
It should be emphasized that the tabulated results for the VENTURE-calculated regulating blade worths have already been reduced by an expected uncertainty of roughly +20 %. Note, for example, that the reported value of 0.39 ![]() in Table I was computed as 0.47
in Table I was computed as 0.47 ![]() . This bias is the result of the modeling approximations used (homogenization procedure) when the VENTURE models were first developed. We have decided to report the total regulating blade worths in this fashion because this estimated worth is expected to be much closer to the actual value that will be observed in the physical system. A preliminary MCNP model of the LEU-fueled UMLRR was used to obtain the rough estimate of the uncertainty in this particular VENTURE calculation.3 In any case, even with this estimated uncertainty applied to the calculated results, the predicted D9 blade worth for the new reference core satisfies the imposed design constraint of 0.35
. This bias is the result of the modeling approximations used (homogenization procedure) when the VENTURE models were first developed. We have decided to report the total regulating blade worths in this fashion because this estimated worth is expected to be much closer to the actual value that will be observed in the physical system. A preliminary MCNP model of the LEU-fueled UMLRR was used to obtain the rough estimate of the uncertainty in this particular VENTURE calculation.3 In any case, even with this estimated uncertainty applied to the calculated results, the predicted D9 blade worth for the new reference core satisfies the imposed design constraint of 0.35 ![]() .
.
The shutdown margin is a measure of the amount of subcriticality that is achievable under worse-case conditions. We define worse case here assuming that the beam ports are flooded (0.44 ![]() ), that the maximum experimental worth of +0.5
), that the maximum experimental worth of +0.5 ![]() is inserted, and that the most reactive blade (Blade #4 with a worth of 3.4 - 3.5
is inserted, and that the most reactive blade (Blade #4 with a worth of 3.4 - 3.5 ![]() ) is stuck out. Adding these positive contributions to the excess reactivity and subtracting the total blade worth gives an estimated shutdown margin of about 4.0 - 4.4
) is stuck out. Adding these positive contributions to the excess reactivity and subtracting the total blade worth gives an estimated shutdown margin of about 4.0 - 4.4 ![]() . This is well above the technical specification limit of 2.7
. This is well above the technical specification limit of 2.7 ![]() .
.
Our estimate of the shutdown margin is expected to be somewhat conservative because the VENTURE-computed flooded beam port worth is probably quite large relative to the worth in the real system. Our treatment of the voided beam ports in the 3-D VENTURE diffusion theory model, for example, was very crude, and certainly the results obtained using this model only represent a rough approximation to reality. The measured worth of the flooded beam ports for the HEU core was about 0.15 ![]() .4 We expect the worth in the LEU core to be slightly higher because of the greater leakage fraction associated with the smaller core (probably 1.5 - 2.0
.4 We expect the worth in the LEU core to be slightly higher because of the greater leakage fraction associated with the smaller core (probably 1.5 - 2.0 ![]() ). Thus, the VENTURE-computed value for the flooded beam port worth is probably high by a factor of two or more.
). Thus, the VENTURE-computed value for the flooded beam port worth is probably high by a factor of two or more.
Table I also shows some approximate worths associated with an experimental sample placed in the radiation basket in position D2 and in the flux trap in grid location D5. The sample here was assumed to be a 45-mil thick (0.1143 cm) borated aluminum plate curved into the shape of a hollow cylinder. The cylinder is 2.36 inches in length (6 cm) and the inside diameter is 1 inch (2.54 cm). This small sample was placed in the axial midplane of the reactor (Level 9 in the LEU315 3-D VENTURE model) and the worth relative to the experiment-free configuration was computed. Although the axial location is modeled accurately, our planar 2-region basket model requires that the sample be homogenized within the inner region of the basket model. This introduces a large uncertainty since smearing a poison material over a much larger area (with a lower density, of course) usually leads to a large over-prediction of the poison worth. Here, with a real sample volume fraction of less than 2%, we expect that the estimated worths will be very high.
Although the model deficiency noted above implies that the values of absolute computed worths are not very reliable, it is expected that the relative worth from position D2 to D5 will be a reasonable prediction of the increase that can be expected in the real system. From Table I we see that, as expected, the worth of the same sample in D5 is much greater than in D2 (0.37 ![]() versus 0.07
versus 0.07 ![]() , respectively). This rough factor of 5 increase in worth in the flux trap relative to a radiation basket on the core periphery is reason for concern, since the current technical specification limit for any movable experiment is only 0.1
, respectively). This rough factor of 5 increase in worth in the flux trap relative to a radiation basket on the core periphery is reason for concern, since the current technical specification limit for any movable experiment is only 0.1 ![]() . Thus, it is possible that a sample that easily meets the worth criterion for use in the radiation basket may not be appropriate for irradiation within the flux trap facility. For normal operation of the new LEU core, a good estimate of the reactivity worth of new experiments placed within the flux trap will have to be carefully estimated prior to use and the actual worth will need to be monitored during operation -- so that the technical specifications for a movable experiment are not violated.
. Thus, it is possible that a sample that easily meets the worth criterion for use in the radiation basket may not be appropriate for irradiation within the flux trap facility. For normal operation of the new LEU core, a good estimate of the reactivity worth of new experiments placed within the flux trap will have to be carefully estimated prior to use and the actual worth will need to be monitored during operation -- so that the technical specifications for a movable experiment are not violated.
The last item to be discussed in this section concerns the differential and integral worth computations that were made. A detailed overview of the procedure for Blade #1 was described in last monthís Progress Report, and we simply continued that same analytical approach to determine the differential and integral worths for the remaining control and regulating blades. In particular, we computed the differential worth at several axial locations, tried fitting three different mathematical models to the data, and then computed the integral worth profiles by integrating the differential worth curves. The models studied in detail were
Model A Theoretical Model
![]()
Model B Cubic Polynomial
![]()
Model C Combined Polynomial and Sinusoid
![]()
where H is the maximum blade traverse. Note that the units for differential worth are ![]() per inch, since these are the units used routinely by the UMLRR operations staff.
per inch, since these are the units used routinely by the UMLRR operations staff.
For completeness, Table II shows the simulated worth data for all five blades in the UMLRR assuming 7 measured data points. The table shows 9 entries because two zero-worth points are added at the ends of the blade traverse for the actual curve fits to give better behavior at these points. A Matlab program was then used to fit the three models given in eqns. (1) - (3) to the data in Table II and Figs. 2 - 6 summarize the result of this exercise. Each figure shows both the fitted differential worth and the resultant integral worth curves.
Focusing first on the differential curves, we see that, in all cases, the combined cubic polynomial plus sinusoid model given by eqn. (3) gives the best fit. In fact, the coefficient of determination (the COD is a measure of the goodness of the fit with unity being a perfect fit) was greater than 0.99 for Model C for all five blades. The CODs for the other models were generally about 0.95 or less. This quantitative measure and a simple visual inspection of the plots clearly indicate that Model C, with the combined polynomial and sinusoid, should be the mathematical model of choice for fitting measured blade worth data at the UMLRR. These data strongly suggest that the current use of Model A should be discontinued, and that Model C, with appropriate automated software for use by the operations staff, be incorporated within the UMLRR blade calibration procedure for the new LEU core.
Finally we note that the total worth of the individual blades is simply the value of the integral worth evaluated at the fully withdrawn position (at 26 inches in Figs. 2 - 6). These total worths have already been tabulated and discussed previously (see the last column of blade worth data in Table I). These data agree well with our simple 2-D control-in versus control-out VENTURE blade worth calculations. The data for the four large control blades are expected to be quite representative of the actual values observed in the physical system. The regulating blade worth uncertainty, however, is expected to be much larger, and a 20% bias has already been applied to the data shown in Table I. Thus, all the blade worth values in Table I are probably quite reasonable.
Table II Simulated differential worth data for the UMLRR LEU core.
|
Differential Worth |
||||||
|
Point |
Interval Midpoint (inches withdrawn) |
Blade #1 |
Blade #2 |
Blade #3 |
Blade #4 |
Reg. Blade |
|
1 |
0.00 |
0.000 |
0.000 |
0.000 |
0.000 |
0.000 |
|
2 |
2.09 |
0.033 |
0.037 |
0.041 |
0.042 |
0.008 |
|
3 |
5.64 |
0.105 |
0.116 |
0.131 |
0.135 |
0.022 |
|
4 |
9.46 |
0.177 |
0.187 |
0.221 |
0.226 |
0.032 |
|
5 |
13.00 |
0.192 |
0.194 |
0.239 |
0.245 |
0.033 |
|
6 |
16.54 |
0.143 |
0.139 |
0.181 |
0.184 |
0.023 |
|
7 |
20.36 |
0.073 |
0.071 |
0.095 |
0.098 |
0.011 |
|
8 |
23.91 |
0.027 |
0.025 |
0.036 |
0.037 |
0.004 |
|
9 |
26.00 |
0.000 |
0.000 |
0.000 |
0.000 |
0.000 |
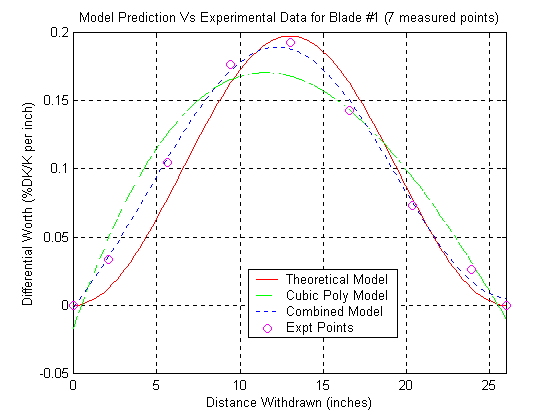
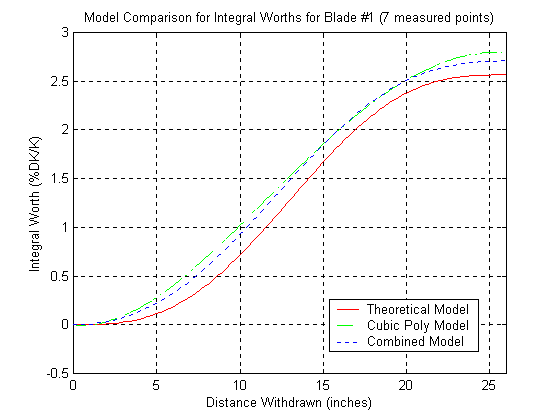
Fig. 2 Differential and integral worth curves for Blade #1.
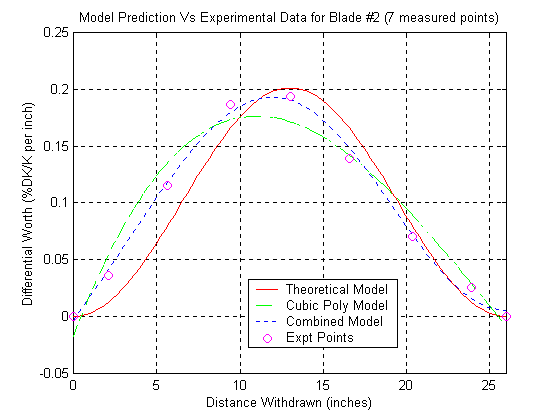
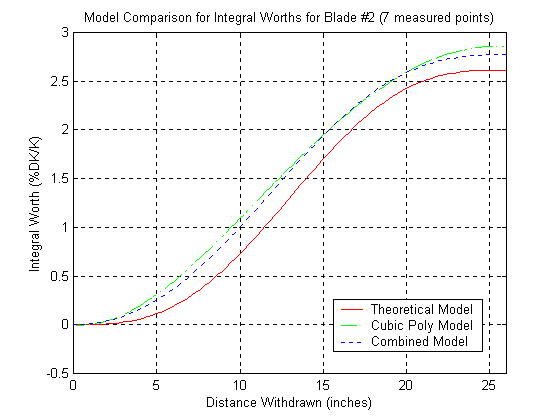
Fig. 3 Differential and integral worth curves for Blade #2.
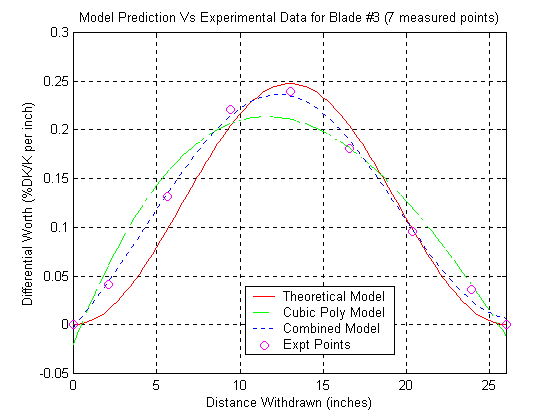
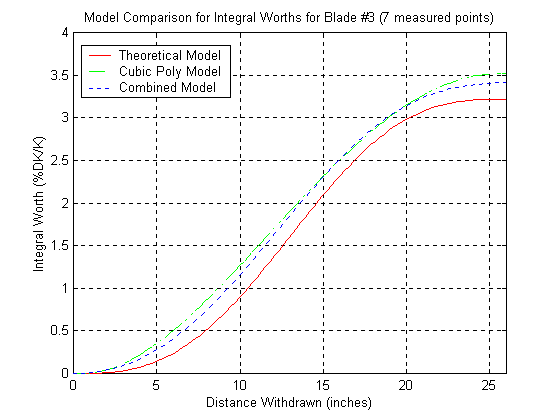
Fig. 4 Differential and integral worth curves for Blade #3.
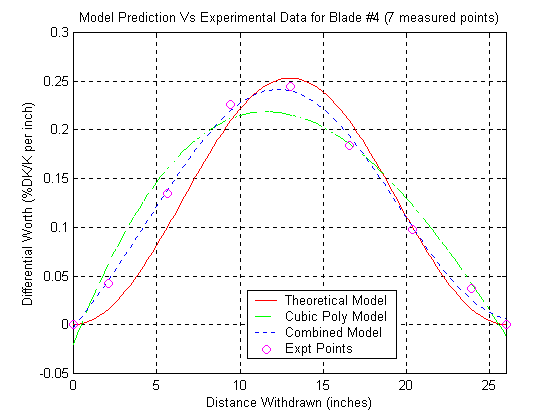
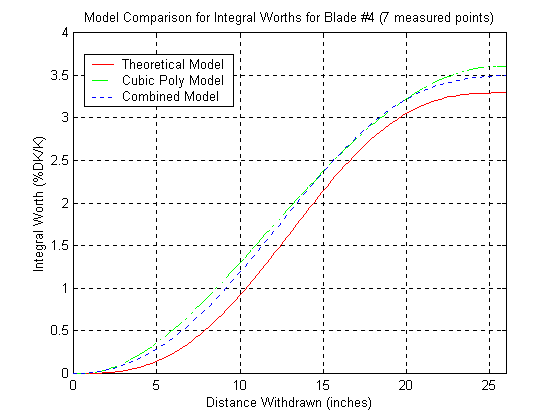
Fig. 5 Differential and integral worth curves for Blade #4.
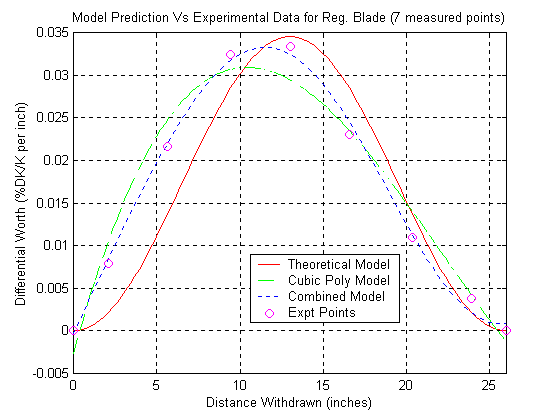
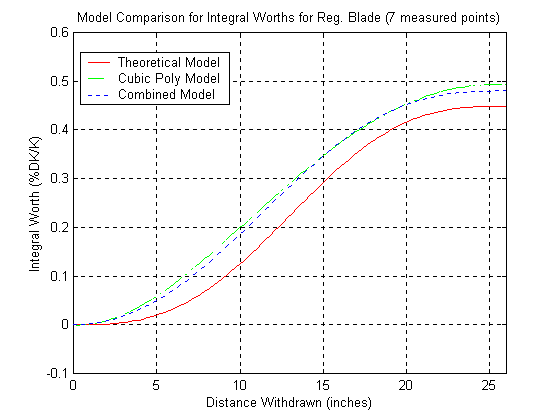
Fig. 6 Differential and integral worth curves for the Regulating Blade.
Characterization of the Experimental Facilities
After establishing the base reactivity characteristics of the new LEU core, the focus of our studies turned towards characterization of the experimental facilities within the UMLRR, including the central flux trap, the radiation baskets on the left core boundary, the six beam ports, and the large thermal column on the right side of the reactor -- see Fig. 1 for proper orientation. A series of zones were defined within the models for edit purposes, and lots of summary information has been accumulated for these regions. In addition, various space- and energy-dependent flux profiles are available that give a good qualitative picture of the overall neutron and gamma flux distributions throughout the system. Summary data from these studies are presented in this section.
Modeling Uncertainties
Before showing the summary results, it should be emphasized that, with the various models and modeling assumptions used, a variety of numerical results is available. Computer modeling always involves some approximation to the real physical system and our knowledge of the underlying physical processes that are present. In the current study, we have compared diffusion theory versus transport theory, 2-D geometry versus 3-D geometry, a buckling versus no-buckling approximation, few-group theory versus multigroup theory, and, to some extent, deterministic modeling versus stochastic modeling (for example, see Ref. 3). There are certainly pros and cons to each method and, of course, the numerical results certainly vary among the different approximations. The various models are all generally self-consistent and they show the same general features in the overall neutron and gamma flux distributions. However, local flux values may vary as much as 25% to 50% or more depending on the location and energy group for the various approximations.
Since we do not have a 3-D, multigroup, transport theory, deterministic model to generate best-estimate results everywhere in the system, we will have to rely on the existing models with their inherent limitations to estimate the radiation environment in the various experimental facilities and to approximate the operational characteristics of the LEU-fueled UMLRR. Although various comparisons have been made, we have generally used the 3-D 2-group VENTURE model as the best estimate of the excess reactivity, blade worths, and various material sample worths within the system. In contrast, the neutron and gamma radiation environment within the experimental facilities are generally obtained from a coupled 67-group (47 neutron and 20 gamma groups) 2-D DORT fixed-source computation. The 2-D DORT model uses a fission source from a consistent 2-D 2-group VENTURE run and a simple DB2 transverse leakage approximation with the same fixed buckling as used in VENTURE.
In addition, all the 2-D flux values have been multiplied by an axial peaking factor of 1.4 to very roughly approximate the fluxes that might be expected in the peak axial plane where many experimental irradiations are made. This indeed is a rough estimate because the axial flux profile varies with energy and radial location. An axial peaking factor of 1.4 is appropriate for the thermal fluxes near the center of the core. However, this is probably a high estimate, for example, for the axial gamma distribution on the core periphery. Lacking additional 3-D space- energy information, a single constant peaking factor is usually applied to the 2-D XY results.
The purpose of the above discussion is to inform the reader that the computational results from this project are only estimates of expected behavior -- and they should be used accordingly. Many of the results are tabulated with three significant figures to maintain consistency and for comparisons of the individual approximations. However, in most cases, this does not imply the level of confidence in the estimated values. In fact, many of the values may have uncertainties as high as 25 - 50 % or more. Thus, for example, the current calculations estimate a peak fast flux above 0.1 MeV in the central flux trap to be about 1.5x10¹³ n/cm2-sec (see Table III below). Quoting this value as 1.43x10¹³ n/cm2-sec without the bayonet inserted and 1.63x10¹³ n/cm2-sec with the bayonet present is probably a misuse of the data presented here. Thus, the reader is cautioned to use the data properly and to consider the inherent uncertainties in the models -- for example, a 2-D model of an inherently 3-D system simply cannot produce 3-D quality results, etc..
Space and Energy Flux Distributions
With the above discussion to put things into proper perspective, we now present a series of qualitative and quantitative results for the reference 21-element LEU startup core. In addition to the bulk processing capability of the PLOT_FLUX code, we have also written a series of small Matlab plotting routines to help visualize the flux profiles for the specific models of interest here. The scalar flux distribution from DORT is read by the PROCESS post-processing code and any number of first dimension, second dimension, and zone-averaged energy-dependent profiles can be tabulated for later use. The small Matlab routines read and plot these data and some typical examples of all three distributions are given here.
NOTE: A more comprehensive set of flux distribution data from the PLOT_FLUX code is also available (see below).
X-Direction Spatial Distributions (I-profiles)
To illustrate the spatial distribution of the fluxes in the reference LEU core configuration, the DORT 67-group information was integrated over energy to give four broad-group fluxes (three neutron groups and one gamma group). These broad-group data, for a Y location that passes through the center of the core, were plotted versus the X variable in Fig. 7 (note that a linear scale is used for the top plot and a log scale is used in the lower curves in Fig. 7). For the neutron data given, the fast group includes neutrons above 0.1 MeV, the thermal group covers energies below 1.0 eV, and the epithermal group includes all energies between these limits. The gamma fine-group fluxes are integrated over all energies to give a single total gamma flux, and this is compared to the total neutron flux (sum of three broad groups) in the bottom part of Fig. 7. The X-directed spatial distributions generally follow expected behavior, as follows:
Y-Direction Spatial Distributions (J-profiles)
A similar set of spatial flux profiles was also generated versus the Y variable along the core centerline in the X direction, and these are displayed in Fig. 8. This Y-directed cut passes through the central beam ports (at the ends) and directly through the flux trap in the center of the core. Again, everything seen here is as expected. For example, the thermal flux peak in the center is the result of the flux trap and the twin peaks on either side of center occur because of the thermalization of the fast neutrons within the water-filled control channels. The large broader thermal peak just inside the core box on the left is due to the source holder that occupies the A5 grid position. A similar discussion for the fast flux easily explains the oscillation-like behavior shown for the fast flux in Fig. 8. This is due to the alternating arrangement of fuel zones and moderating regions (the side plates, the central flux trap, and the water-filled control channels). In the fuel regions the fast flux is high and the thermal flux is low, and just the opposite occurs in the moderating regions.
Spectral Distributions (E-profiles)
The 67-group DORT fluxes in several irradiation regions were averaged over the spatial zone of interest and separated into a neutron flux vector (47 groups) and a gamma flux vector (20 groups). These data for the radiation basket in D2, the flux trap in D5, and two beam port edit regions near the core box are plotted versus energy in Figs. 9 and 10 -- the neutron spectra are in Fig. 9 and the gamma spectra are shown in Fig. 10. These two figures illustrate the general spectral characteristics expected within the UMLRR and they are typical of water-cooled thermal systems. The individual neutron and gamma spectral distributions are qualitatively similar (on a log scale) but, of course, the magnitudes vary by zone.
Integral Results for the Irradiation Facilities
One often would like to have a single number to characterize the flux spectrum in a given location and energy region. This information can be approximated from the space and energy profiles just discussed but, because the variation is so rapid in some regions, this approach is very approximate at best. However, the post-processing steps mentioned above also perform integrals over energy and space as desired (defined via user input). In particular, the zone-average values for the broad-group fluxes and other responses for several irradiation zones were extracted from the code output and they are summarized in Table III. The data are broken into three broad categories -- broad-group fluxes, additional characterization of the fast flux component of the spectrum, and information concerning energy deposition rates in the various facilities.
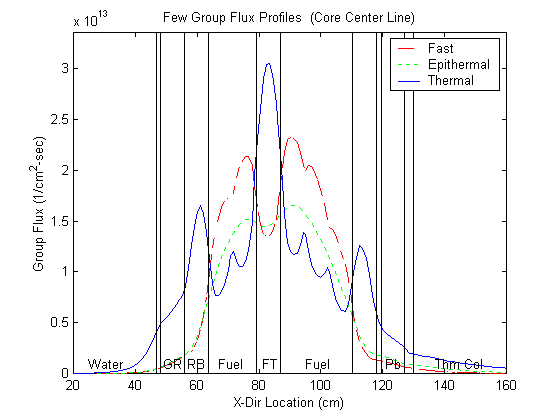
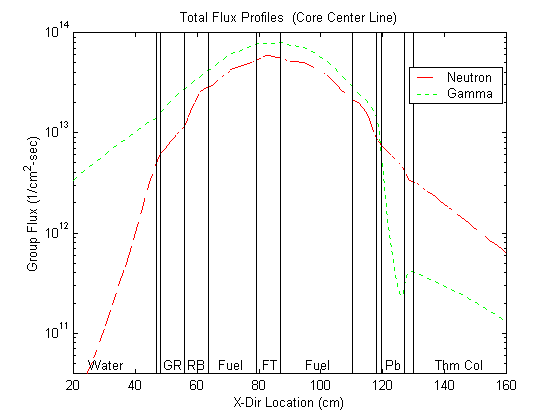
Fig. 7 Typical X-directed flux profiles along core centerline.
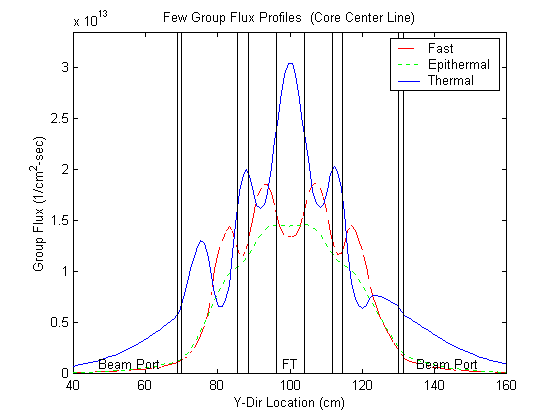
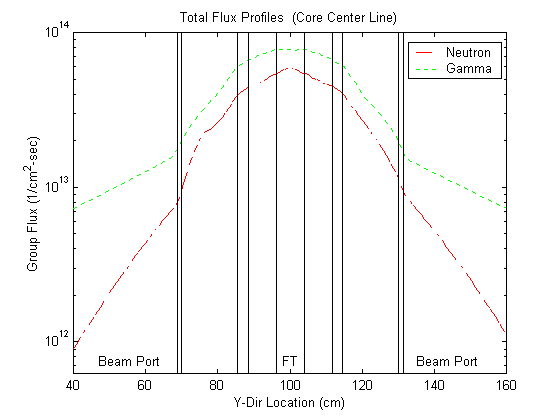
Fig. 8 Typical Y-directed flux profiles along core centerline.
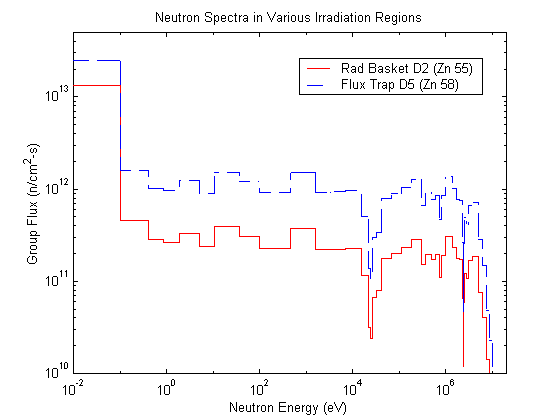
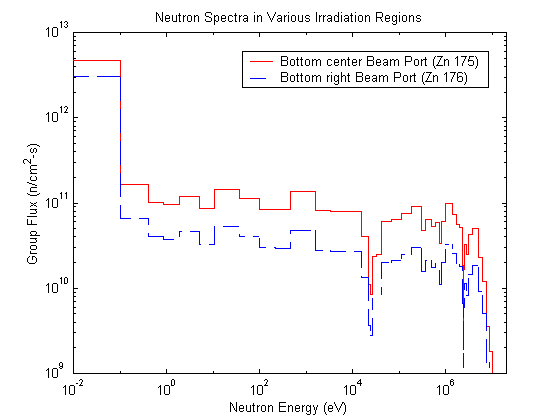
Fig. 9 Neutron flux spectra in various irradiation facilities.
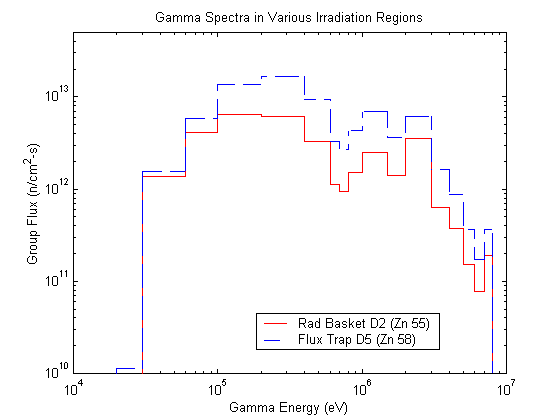
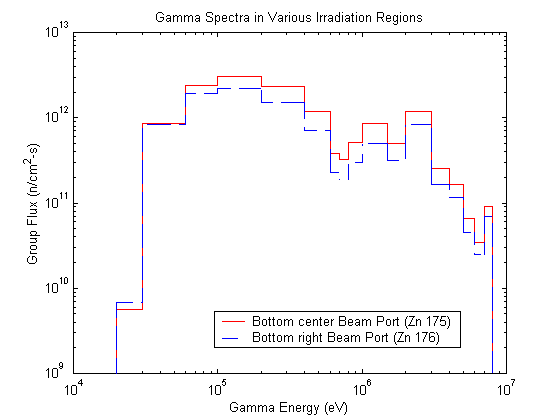
Fig. 10 Gamma flux spectra in various irradiation facilities.
Table III Average flux data and other responses for several irradiation regions in the reference LEU core.
|
Irradiation Region |
Radiation Basket (D2) (Zone 55) |
Flux Trap (D5) (Zone 58) |
Center Beamport (Zone 175) |
Right Beamport (Zone 176) |
Thermal Column (Zone 177) |
Thermal Column (Zone 178) |
||
|
Parameter of Interest |
no bayonet |
with bayonet |
no bayonet |
with bayonet |
no bayonet |
no bayonet |
no bayonet |
no bayonet |
|
Broad Group Fluxes (n/cm2-sec) |
||||||||
|
Fast Flux (> 0.1 MeV) |
3.33E+12 |
3.78E+12 |
1.43E+13 |
1.63E+13 |
1.01E+12 |
3.44E+11 |
2.68E+11 |
7.10E+10 |
|
Epithermal Flux |
3.64E+12 |
4.07E+12 |
1.47E+13 |
1.55E+13 |
1.31E+12 |
4.65E+11 |
5.99E+11 |
2.58E+11 |
|
Thermal Flux (<1 eV) |
1.41E+13 |
1.35E+13 |
2.74E+13 |
2.09E+13 |
5.00E+12 |
3.17E+12 |
1.54E+12 |
9.05E+11 |
|
Total Neutron Flux |
2.10E+13 |
2.14E+13 |
5.64E+13 |
5.27E+13 |
7.32E+12 |
3.98E+12 |
2.40E+12 |
1.23E+12 |
|
Total Gamma Flux |
3.39E+13 |
3.35E+13 |
7.75E+13 |
7.50E+13 |
1.41E+13 |
9.97E+12 |
3.33E+11 |
2.20E+11 |
|
Additional Fast Flux Characterization |
||||||||
|
Fast Flux (> 1 MeV) |
1.75E+12 |
1.97E+12 |
7.27E+12 |
8.15E+12 |
5.11E+11 |
1.79E+11 |
8.75E+10 |
2.17E+10 |
|
Fast Flux (> 0.01 MeV) |
4.12E+12 |
4.67E+12 |
1.78E+13 |
2.01E+13 |
1.28E+12 |
4.33E+11 |
4.07E+11 |
1.22E+11 |
|
1 MeV Equivalent Flux |
3.13E+12 |
3.53E+12 |
1.32E+13 |
1.49E+13 |
9.34E+11 |
3.22E+11 |
2.11E+11 |
5.49E+10 |
|
RDF |
0.76 |
0.76 |
0.74 |
0.74 |
0.73 |
0.74 |
0.52 |
0.45 |
|
Energy Deposition Rate (rad/hr) |
||||||||
|
Neutrons in Air |
3.09E+07 |
3.03E+07 |
6.81E+07 |
5.74E+07 |
1.07E+07 |
6.51E+06 |
3.14E+06 |
1.79E+06 |
|
Neutrons in Water |
3.27E+07 |
3.69E+07 |
1.37E+08 |
1.55E+08 |
9.71E+06 |
3.36E+06 |
2.19E+06 |
5.84E+05 |
|
Gammas in Air |
3.84E+07 |
3.84E+07 |
9.04E+07 |
8.86E+07 |
1.42E+07 |
9.38E+06 |
4.39E+05 |
1.94E+05 |
|
Gammas in Water |
4.26E+07 |
4.26E+07 |
1.00E+08 |
9.83E+07 |
1.57E+07 |
1.04E+07 |
4.85E+05 |
2.16E+05 |
The broad-group neutron flux data are tabulated as fast, epithermal, and thermal fluxes with the same energy bins as described above. Also included are entries for the total neutron and gamma particle flux in the particular zone of interest. These data from Table III can be correlated directly to the information given in Figs. 7 - 10. Also tabulated are estimates of the average fluxes that would be observed if the experimental bayonets were inserted into the radiation basket in D2 and the flux trap in D5 (this was done in a single perturbation calculation). As apparent, a sizable perturbation relative to the experiment-free fast and thermal fluxes near the irradiation locations is observed. This is highlighted even further in Fig. 11, where we compare the X-directed flux profiles for the cases with and without the bayonet present. In this case, the air-filled bayonet displaces some of the water in the irradiation zone, which results in a higher fast flux and a lower thermal flux in the vicinity of the perturbation. This illustration is important since it emphasizes that the insertion of experiments into the UMLRR can cause fairly large local flux perturbations -- and most of the results given here are for the reference experiment-free configuration.
Additional characterization of the fast component of the spectrum is important because many of the material irradiations performed in the UMLRR focus on fast neutron studies. Many researchers are interested in the neutron fluence above 1 MeV, while others include all neutrons above 0.01 MeV (plus we have already tabulated the > 0.1 MeV flux as group 1 of the 3-group structure). In addition, because of the historical use of the facility for irradiation of electronic components, it is also important to quantify the so-called 1 MeV equivalent flux for silicon displacement in the various experimental locations of the UMLRR. This quantity is formally defined5 as

where KD(E) is the neutron displacement kerma for silicon as a function of energy, Eo is the reference energy of interest, and Emin and Emax specify the energy range for significant atomic displacement in silicon. Reference 5 suggests the use of 0.01 MeV and 18 MeV as limits for the energy range of interest and Eo is usually 1 MeV. The suggested value for the displacement kerma at 1 MeV is 95,000 eV-b, and this is used as KD(Eo) in eqn. (4).5 The energy-dependent kermas used in this study were obtained from the BUGLE-96 library,6 since the 47-group energy structure in BUGLE-96 is identical to the energy bins chosen for this study.2
Reference 5 also defines the "neutron energy spectrum hardness parameter" or simply the relative damage factor (RDF). The RDF is given by

where ![]() is the total energy-integrated flux over the interval of interest. The RDF is a convenient measure for characterizing the spectrum of a particular facility. It represents the fluence of 1 MeV neutrons required to produce the same displacement kerma in silicon as a unit fluence of neutrons of spectral distribution
is the total energy-integrated flux over the interval of interest. The RDF is a convenient measure for characterizing the spectrum of a particular facility. It represents the fluence of 1 MeV neutrons required to produce the same displacement kerma in silicon as a unit fluence of neutrons of spectral distribution ![]() .
.
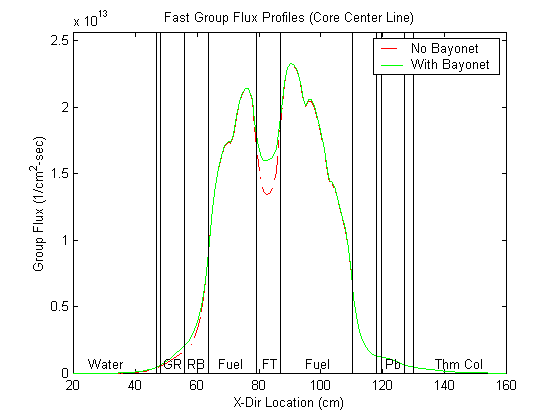
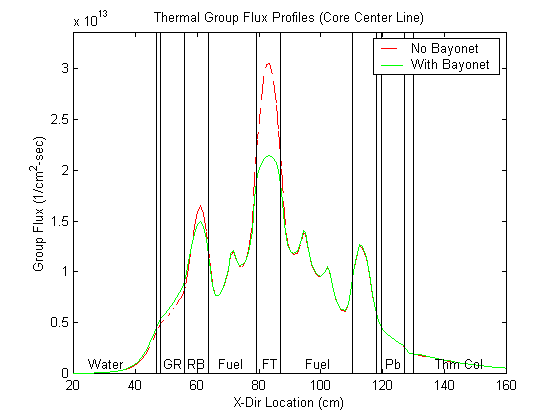
Fig. 11 Effect of the experimental bayonet on the local flux distribution.
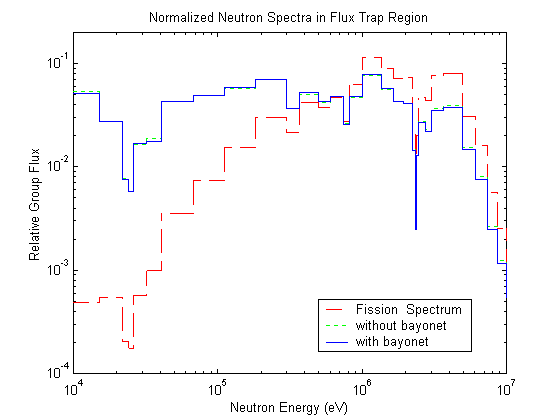
Fig. 12 Flux spectra in central flux trap relative to the fission spectrum.
The relative damage factor (RDF) and the other fast flux characterization parameters are given in the second part of Table III. As expected, the flux trap has the largest fast fluence, with some fast flux values above 1x10¹³ n/cm2-sec. However, the RDF for the beamports, radiation baskets, and flux trap are all in a narrow range of 0.73 - 0.76. This indicates that the fast spectra above 0.01 MeV in these regions are very similar. Also, as expected, the RDF in the two thermal column edit zones is significantly lower, indicating a much softer flux spectrum in this particular irradiation facility.
It should be noted that a prior experimental study of the RDF for the UMLRR HEU core gives values of the RDF near unity.7 A brief review of Ref. 7 could not identify why the RDF would be so different for the LEU core (only about 0.75). In fact, we made some auxiliary computations to show that the maximum value the RDF can have in a U235 fueled reactor is about 1.05. The spectrum of neutrons released from fission in U235 is referred to as the fission spectrum. This distribution of neutron energies peaks near 1 or 2 MeV and it drops fairly rapidly at energies below and above this range. The fission spectrum is the hardest distribution that neutrons can possibly have within a nuclear reactor. Interaction of the fission neutrons with the other materials in the system decrease the neutronís energy and tends to soften the spectrum significantly -- especially in a thermal reactor.
Figure 12 gives a good illustration of this spectrum softening by comparing the fast neutron spectra computed within the central flux trap with the U235 fission spectrum -- and clearly the neutron spectra available within the UMLRR irradiation facilities is significantly softer than the distribution of uncollided fission neutrons. Since the energy distribution of the silicon displacement kerma, KD(E), is a generally decreasing function with decreasing energy below about 1 MeV (see Ref. 5), we expect that the RDF computed with the flux trap spectrum to be significantly lower than an RDF computed with the pure fission spectrum. With a maximum RDF of 1.05, the computed value of about 0.75 for most of the UMLRR irradiation facilities seems very reasonable. This does, however, create a dilemma because this is in direct contrast to the values reported in Ref. 7. But, based on the straightforward arguments given here, a RDF near unity -- with the definitions used in this study -- is not really an achievable goal in a thermal system.
Finally, Table III also gives some data concerning energy deposition in air and in water for the different UMLRR irradiation facilities. The kerma factors used to compute these dose rates are directly from the BUGLE-96 library.6 These data are useful as a qualitative indication of the expected dose rates in the various facilities. For a particular experiment, material-specific kermas would be needed to estimate actual energy deposition within the specific sample. The dose rate data in the bottom part of Table III are still useful, however, because they give a good indication of the relative neutron and gamma dose rates and how these vary for the different experimental facilities.
Future Work
This report brings the computational analysis phase of this project to completion. We have accomplished our primary goals, and a large database of information for the new LEU core is now available. We now have a series of computer models that can help answer many of the common questions that arise during operation. We have reasonable estimates of the excess reactivity and total blade worths for the new reference 21-element LEU core, an initial loading sequence has been proposed and simulated, differential and integral blade worth data have been simulated and a new curve fitting procedure for use with the experimentally determined differential worth data has been proposed and, finally, data generated within the last reporting period have helped characterize the radiation environments that are expected within several of the experimental facilities in the UMLRR. Certainly the computational models have inherent limitations, but the results generated here (with some notable exceptions like the small sample worth calculation in the 3-D VENTURE model) should paint a reasonably accurate picture of expected behavior of the new LEU core. Definitive validation of the model predictions is nearly impossible until direct comparisons to measured data are made. Our studies will not be 100% complete until rigorous comparisons of our model prediction capability and the measured data from the operating facility are performed. Hopefully this will take place during the spring and summer of 2000 when the new LEU core is operational and experimental data begins to become available.
In addition to the model validation efforts that are certainly required as future work, there are two more model development issues or deficiencies that should be resolved as part of future studies. As mentioned in this Progress Report, the current VENTURE models cannot accurately address the reactivity worth of a small sample inserted into the radiation basket or flux trap facilities. The 2-region basket model incorporated into the overall VENTURE core models requires that the sample be homogenized within the existing central zone geometry. The smearing or homogenization of a poison sample within a much larger volume often leads to serious over prediction of the sample worth, even when the appropriate atom density reduction is treated. The current VENTURE zone geometry could be reduced in size to try to minimize the homogenization problem but, unfortunately, we may never be able to eliminate this problem completely -- because the required mesh sizes could become prohibitive.
The prediction of small sample worths is particularly important in the new LEU core because of the central flux trap facility. It is expected that the worths in this location could become quite large, even for samples that are used routinely in the radiation basket region. We expect that an increase in worth of about a factor of 3 to 5 or more may be observed when a given sample is moved from the D2 position to the D5 position. This means that an accurate prediction of the sample worth in the flux trap will be required to assure that appropriate Technical Specification limits for movable experiments are not exceeded -- and the current VENTURE model is simply not suitable for this task. Thus, we strongly recommend that additional efforts be made to enhance and validate an existing (but very preliminary) MCNP model of the LEU fueled UMLRR.3 A well documented and fully validated MCNP model, with its explicit geometry capability, could easily handle the prediction of small sample worths, and it could be generally useful for complete pre-analysis of any new proposed experimental configuration. Such capability would be a tremendous asset to complement our existing modeling tools, and with the potential for high reactivity worths in the flux trap location, it could easily become an essential component of the safety review that accompanies any new experiment within the facility.
The final modeling concern that should be given priority for future work relates to the extension of our current modeling capability to allow analysis beyond the initial LEU core configuration. The VENTURE code has integrated fuel burnup capability within the BURNER module. Our existing models can easily be enhanced so that fuel depletion calculations can be performed to allow core follow and prediction capability well into the next century. Developing a cross section library that is suitable for depletion analysis is always a challenge, but this task simply requires extension of the procedures and tools used to generate the cross sections for the current study.2 In short, fuel depletion capability within the existing models would allow us to continue our analytical support of the UMLRR for the next 20 - 30 years or more. This would certainly be beneficial for continued operational support throughout the life of the facility and it also increases the overall usefulness and cost-benefit of all the capability developed as part of the current study.
References
NOTE: A set of selected 1-D profiles and 2-D color surface plots of the geometry and material layout, the power density distribution, and the few-group fluxes for the 2-D and 3-D VENTURE models and for the 2-D DORT model are also available. These data can be viewed by selecting the appropriate item of interest.
2-D VENTURE/DORT LEU215 model: 3-D VENTURE LEU315 critical core (control blades at critical height): Back